

Today’s infographic will bring you either joy (as a marketer) or grief (as a consumer).
Influencer marketing company MediaKix compiled time usage stats for various social media platforms and put the data together in a handy infographic.
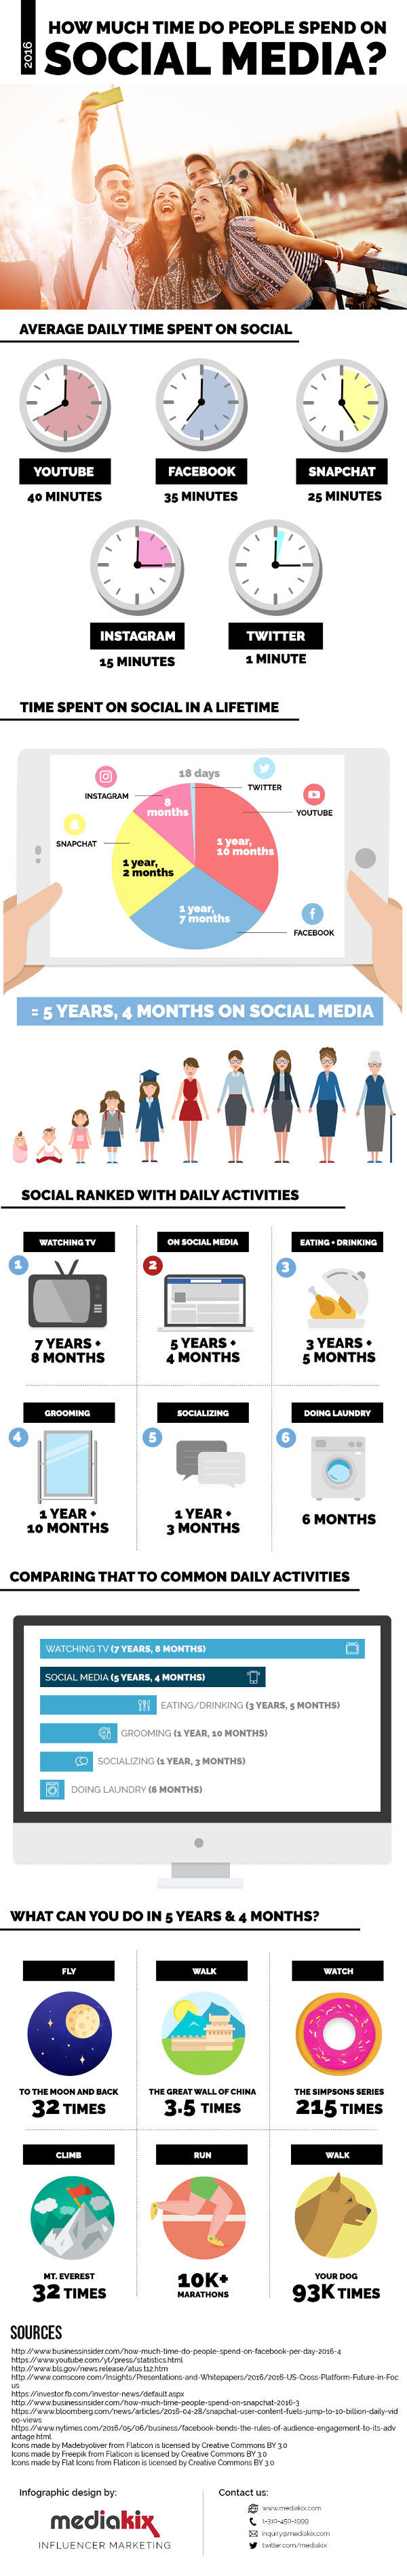
The average time spent daily on each of five major social media platforms varies from one minute on Twitter to forty minutes on YouTube, both of which add up to quite a bit over a lifetime.
For instance, those forty minutes per day on YouTube will average out to one year, ten months over a lifetime. And you can plan to spend another year plus seven months on Facebook.
People spend more time on social media than they do eating and drinking, the infographic suggests, but less than they do watching television.
To see time spent across YouTube, Facebook, Snapchat, Instagram, and Twitter, check out the infographic:


